EB Weekly Market Recap Video
If you haven’t seen our latest weekend recording, it’s now available HERE at YouTube.com.
Sample – EB Weekly Market Report
This is a sample of our Weekly Market Report that is sent to EB members every Monday. We also provide a Daily Market Report (DMR) every Tuesday through Thursday and a quick market update on Friday, but this Weekly Market Report is designed with the long-term in mind. I discuss many concepts in this report from week to week, and many of them have been the signals we’ve used to keep our members on the right side of the market for the past several years, including our suggestion to get out of the market early in 2022, just before the 28% cyclical bear market decline.
We also have a BIG members-only event tomorrow, discussing the current state of the market and what to expect over the next several months. Please consider signing up for our 30-day FREE trial and join us for tomorrow night’s event. You can get more information and register for this free event by CLICKING HERE. Either way, enjoy this Weekly Market Report.
Weekly Market Recap
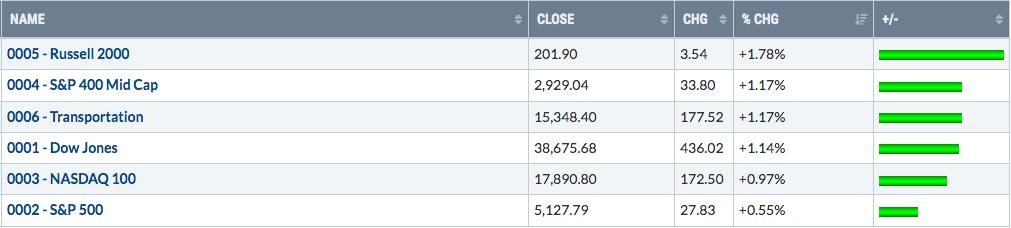
Major Indices
Small and mid caps showed leadership last week. In fact, the IWM is outperforming all of our other major indices over the past month and is second only to mid caps over the past 3 months. If we’re starting another upside move now, it’ll be very interesting to see if small caps continue to lead or if money rotates back towards those large cap growth names.
Sectors
Communication services (XLC) wasn’t the top performer last week, but technically, the XLC does appear to have broken its recent downtrend:
The price action and PPO both look bullish and we saw the RSI bounce off of the key 40 support level. The bears are hoping that (1) the XLC fails to break above short-term price resistance near 81, and (2) the RSI fails to break back up above 60. I believe neither will occur, but we have moved into a more cautious historical period, so we need to remain objective.
Top 10 Industries Last Week
Don’t count out financials just yet. The full line insurance ($DJUSIF) group is breaking out of a cup with handle today:
Bottom 10 Industries Last Week
Consumer finance ($DJUSSF) didn’t have a great week last week, but was it the completion of an A-B-C correction pattern? If so, the 20-day EMA needs to be cleared to confirm the potential start of another uptrend.:
The persistent negative divergence indicated a possible loss of momentum, which suggests the increased likelihood of a decline. We’ve seen that decline quite clearly.
Top 10 Stocks – S&P 500/NASDAQ 100
Bottom 10 Stocks – S&P 500/NASDAQ 100
Big Picture
The monthly PPO continues to push higher and away from centerline support. This is indicative and consistent with how the S&P 500 behaves during secular bull markets. Also, note that RSI 40 support tests have been successful since the financial crisis in 2008/2009. This is another sign that the secular bull market remains alive and kicking.
Both our 10-year and 20-year rate of change (ROC) panels show that highs during this secular bull market have not come close to previous secular bull market highs. It’s telling me we still have much further to go.
Sentiment
Let’s revisit the 253-day SMA of the equity only put call ratio ($CPCE). I want to refresh everyone’s memory as to what happens to the S&P 500 when this sentiment indicator tops with readings showing EXTREME fear:
Bet against this chart at your own risk. Personally, I believe that sentiment plays a much bigger role in stock market direction than most folks give it credit for. Every single major S&P 500 advance during this secular bull market has occurred with a significant top in the 253-day SMA of the CPCE. When this moving average is falling, you want to be on the long side…..PERIOD! This doesn’t mean there aren’t pullbacks. There simply aren’t pullbacks that morph into bear markets.
Rotation/Intermarket Analysis
Here’s the latest look at our key intraday ratios as we follow where the money is traveling on an INTRADAY basis (ignoring gaps):
QQQ:SPY
First, a quick reminder. While this chart is named “@SPYQQQ”, it’s actually the QQQ divided by the SPY. When this line is rising, it means the QQQ is outperforming the SPY (“risk on” environment). When it’s falling, it means the SPY is outperforming the QQQ (“risk off” environment). We’ve clearly been in a downtrend as money has rotated towards defensive- and value-oriented stocks. The past few days, this has changed and you can see the lines turning higher. The key to a sustainable upside move will be the continuation of this ratio to the upside.
IWM:QQQ
On an intraday basis, small caps (IWM) have performed well over the past several months. But gaps have not worked in their favor, which is why small caps have trailed the QQQ and SPY year-to-date and over the past 6 months. In my opinion, the gaps are disguising the underlying strengthening of the IWM. Time will tell if I’m correct or not.
XLY:XLP
The XLY hasn’t performed great vs. the XLP, but opening gaps are masking the true picture, which I believe is that discretionary stocks are stable relative to staples stocks – at least in 2024 thus far.
Key Sector/Industry Charts
Perhaps the biggest industry group chart to show you right now is semiconductors ($DJUSSC). We know this group can light a fire under a secular bull market rally and we’re seeing a breakout of the recent downtrend/consolidation:
Nothing guarantees us higher prices ahead, but if I had my pick of one industry group to break out, it’d be this one. The PPO is now testing its centerline from underneath, which can be a challenge. But we’ve already seen a move above key trendline resistance and both moving averages. Technical improvement is clear.
Trade Setup
Since beginning this Weekly Market Report in early September, I’ve discussed the long-term trade candidates below that I really like. Generally, these stocks have excellent long-term track records and many pay nice dividends that mostly grow every year. Only in very specific cases (exceptions) would I consider a long-term entry into a stock that has a poor or limited long-term track record:
JPM
BA
FFIV
MA
GS
FDX
AAPL
CHRW
JBHT
STX
HSY
DIS
MSCI
SBUX
KRE
ED
AJG
Keep in mind that our Weekly Market Reports favor those more interested in the long-term market picture. Therefore, the list of stocks above are stocks that we believe are safer (but nothing is ever 100% safe) to own with the long-term in mind. Nearly everything else we do at EarningsBeats.com favors short-term momentum trading, so I wanted to provide an explanation of what we’re doing with this list.
I don’t have any additions to list “long-term” list at this time.
Looking Ahead
Upcoming Earnings:
Q1 earnings are underway and accelerating. I’ve identified what I believe are key companies that will report this week, with their respective market caps in parenthesis. This is NOT a list of ALL companies reporting this week, so please be sure to check for earnings of any companies that you own or add. Any companies in BOLD represent stocks in one of our Portfolios:
Monday: VRTX ($103 billion), PLTR ($50 billion), MCHP ($48 billion)
Tuesday: DIS ($207 billion), ANET ($82 billion), TDG ($71 billion)
Wednesday: UBER ($143 billion), ABNB ($102 billion), SHOP ($93 billion)
Thursday: RBLX ($24 billion), AKAM ($15 billion)
Friday: ENB ($77 billion)
Key Economic Reports:
Monday: None
Tuesday: None
Wednesday: None
Thursday: Initial jobless claims
Friday: May consumer sentiment
Historical Data
I’m a true stock market historian. I am absolutely PASSIONATE about studying stock market history to provide us more clues about likely stock market direction and potential sectors/industries/stocks to trade. While I don’t use history as a primary indicator, I’m always very aware of it as a secondary indicator. I love it when history lines up with my technical signals, providing me much more confidence to make particular trades.
Below you’ll find the next two weeks of historical data and tendencies across the 3 key indices that I follow most closely:
S&P 500 (since 1950)
May 6: -35.12%
May 7: -37.30%
May 8: +58.06%
May 9: -41.62%
May 10: -13.57%
May 11: -50.36%
May 12: +18.78%
May 13: -7.49%
May 14: -20.15%
May 15: +9.23%
May 16: +11.47%
May 17: -18.79%
May 18: -13.84%
May 19: -25.73%
NASDAQ (since 1971)
May 6: -57.65%
May 7: -58.48%
May 8: +76.53%
May 9: -53.65%
May 10: -17.03%
May 11: -19.11%
May 12: +33.12%
May 13: -16.95%
May 14: +13.42%
May 15: +35.21%
May 16: +52.22%
May 17: -36.99%
May 18: -9.09%
May 19: -42.21%
Russell 2000 (since 1987)
May 6: -85.09%
May 7: -95.97%
May 8: +77.52%
May 9: -36.57%
May 10: +1.29%
May 11: -50.24%
May 12: +0.46%
May 13: -84.43%
May 14: +10.37%
May 15: +29.02%
May 16: +20.18%
May 17: -23.07%
May 18: +82.33%
May 19: -41.25%
The S&P 500 data dates back to 1950, while the NASDAQ and Russell 2000 information date back to 1971 and 1987, respectively.
Here’s a quick historical analysis of the S&P 500 during May since 1950:
May 1-5: +29.94%
May 6-25: -12.10%
May 26-31: +37.27%
Final Thoughts
The bulls took advantage of a bullish historical week (May 1-5) and we saw a nice rally to close out the week. We’re now much better positioned to handle any short-term selling and, quite honestly, aren’t far from breaking out on a couple of major indices/sectors/industry groups. I love the VIX falling back down below 14 after bouncing over 16 on Wednesday and Thursday. Of course, the VIX topped above 19.50 in April, remaining just below what I consider to be a key level of 20.
Here are several things to consider in the week ahead:
Economic Reports. There are only two meaningful economic reports out all week – initial jobless claims and consumer sentiment and both of those will be out in the second half of the week.
Earnings. There are fewer and fewer market-moving earnings reports out this week. ABNB and UBER are large caps and will give us a look into the health of the consumer, but otherwise we’ll be getting a number of small cap and mid cap companies quarterly reports.
Interest Rates: The 10-year treasury yield ($TNX) seemingly topped last week. It had a chance to break above a key area of yield resistance from 4.65%-4.70%. It did make one close slightly above 4.70%, but that now appears to have been a false breakout. The question this week, after losing 20-day EMA support last week, is can the TNX hang onto key yield support from 4.39% down to 4.30%. If the TNX continues falling, it would be excellent news for the small cap IWM.
Semiconductors ($DJUSSC): In my opinion, this is the most important industry group during a secular bull market and it appears the group is breaking above a 2-month downtrend line. Let’s see if we confirm this breakout, or if it turns out to be a head fake.
Commodities. Can energy (XLE) hold 50-day SMA support? Can gold ($GOLD) jump back above its 20-day EMA? Can materials (XLB) get past last Wednesday’s high and close there?
Growth vs. Value. Growth stocks have been downtrending vs. value stocks for much of the past 2-3 months, but May through August is historically the best 4-month period of the entire year for growth stocks relative to value.
History. We literally have just started today a challenging historical period for stocks, from May 6th through May 25th.
Feedback
If you’d like to share your thoughts on our Weekly Market Report, positive or negative, you can reach us at “support@earningsbeats.com”.
Happy trading!
Tom


